PRICE DROP
1/1,000×
Since 1976
TANDEM RECORD
34.85%
LONGi · NREL certified · Apr 2025
CHINA MODULE PRICE
$0.08/W
TOPCon · Jan 2025 · down 46% YoY
From Space to Your Rooftop: The 50-Year Price Collapse
In 1954, Bell Labs produced the first practical silicon solar cell. It converted about 6% of sunlight into electricity and cost roughly $286 per watt — roughly equivalent to $3,200 in today’s dollars. The technology found its first real customer not in homes or power grids, but in satellites, where the price of failure was measured in billions and the cost of fuel was irrelevant.
For two decades, solar remained a curiosity for aerospace engineers. That changed in 1973, when the OPEC oil embargo sent energy prices surging and forced governments to think seriously about alternatives. The United States launched the National Photovoltaics Program. Germany began investing in solar research. Japan followed. The modern solar industry was not born from environmental idealism — it was born from geopolitical fear.
By 1976, module prices had fallen to around $100 per watt — still far too expensive for grid applications, but a dramatic improvement over the early 1970s. What followed was one of the most consistent cost-reduction curves ever recorded in any industry. Economists call it Swanson’s Law: for every doubling of cumulative solar panel shipments, the price drops by approximately 20%. It has held with remarkable consistency for five decades.
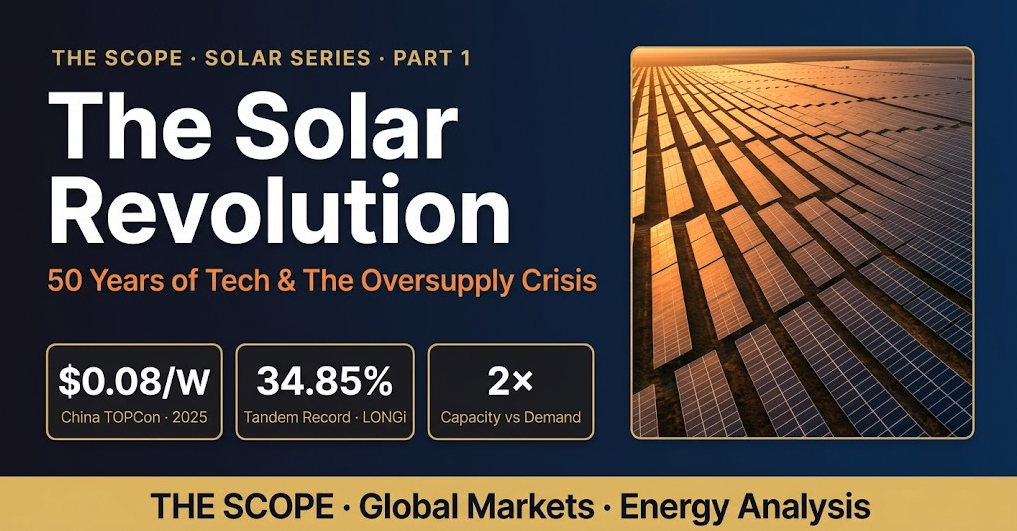
The numbers tell a story that defies intuition. A technology that once cost more than gold per unit of output now costs less than a cup of coffee per watt. And the curve has not flattened. Between 2023 and 2025, China’s aggressive capacity expansion pushed module prices to new all-time lows, with Chinese TOPCon modules trading at $0.08–0.09 per watt — a 46% year-over-year drop that forced manufacturers across the globe into loss-making territory.
The Technology Race: From PERC to TOPCon to Perovskite Tandem
To understand where solar is going, you need to understand the technology stack that got it here. The efficiency ceiling for a single-junction silicon solar cell — the theoretical maximum set by the laws of physics — is about 29.4%, known as the Shockley-Queisser limit. For decades, the industry treated this as a distant horizon. Today, mass-market panels are approaching 24–26% efficiency, and the next generation is already breaking through the ceiling.
PERC (Passivated Emitter and Rear Cell) dominated the 2010s. By adding a reflective layer to the rear of the cell, it captured light that would otherwise be wasted. PERC lifted commercial efficiency from around 17% to 22–23%, and its manufacturing costs were low enough for mass adoption. For most of the last decade, PERC was solar.
TOPCon (Tunnel Oxide Passivated Contact) arrived as the successor. Rather than simply reflecting lost light, TOPCon reduces energy loss at the electrical contacts — where electrons “leak” back into the cell rather than flowing into the circuit. The result is a theoretical efficiency ceiling of around 29%, and real-world commercial products already hitting 25–26%. By 2025, virtually every major Chinese manufacturer had shifted to TOPCon as their flagship product, with modules exceeding 650W becoming the new benchmark for utility-scale deployment.
MAINSTREAM · 2010s
PERC
22–23%
Commercial efficiency ceiling. Now being phased out as TOPCon scales.
MAINSTREAM · 2024–2026
TOPCon
25–26%
Current industry leader. 650W+ modules. China producing at $0.08/W.
NEXT GENERATION
Perovskite Tandem
34.85%
LONGi world record, NREL certified, April 2025. Commercialization: 2027–2029.
The most consequential technology in development is the perovskite-silicon tandem cell. Rather than replacing silicon, it stacks a perovskite layer on top of it. Silicon captures red and infrared light efficiently; perovskite captures blue and green light. Together, they convert a far broader spectrum of sunlight than either material alone, breaking through the single-junction efficiency ceiling entirely.
The efficiency race in tandem cells has become a proxy war between China’s leading manufacturers. In April 2025, LONGi set the internationally recognized world record at 34.85%, certified by the US National Renewable Energy Laboratory (NREL) — the gold standard for solar cell testing. JinkoSolar followed with 34.82% in June 2026, certified by a Chinese institute. The gap between the two results is smaller than the measurement uncertainty; what matters is the direction: efficiency is moving fast, and the physics suggests 40%+ tandem efficiency is achievable within this decade.
The Paradox of Success: Why the Technology “Won” But the Industry Is Struggling
Here is the uncomfortable truth that most solar narratives gloss over: the industry’s greatest technological triumph has produced one of the worst operating environments in manufacturing history. The same cost collapse that made solar the cheapest electricity source in most of the world has also made it nearly impossible to earn a profit making the panels.
The numbers are stark. By early 2025, global solar module manufacturing capacity had expanded to roughly twice actual annual demand. China’s polysilicon — the essential raw material for silicon solar cells — collapsed from peak prices of $40 per kilogram in 2022 to around $5 per kilogram in China by late 2024. Chinese module prices fell 46% year-over-year. Companies were selling below cost to maintain market share.
⚠ OVERSUPPLY CRISIS · KEY INDICATORS · 2025
2×
Global capacity vs. demand
–46%
China TOPCon price YoY (2024)
–11%
Cell gross margin (Tongwei, 2025)
$1B+
Projected 2025 net loss · major manufacturers
This is not the first time the solar industry has been here. In 2011–2013, a nearly identical dynamic unfolded: Chinese manufacturers flooded global markets with subsidized panels, US and European producers collapsed (Solyndra became the famous casualty), and prices crashed by over 75% in three years. The industry consolidated, the survivors emerged stronger, and the next growth cycle began.
The current crisis is structurally similar — but larger in scale and complicated by new geopolitical dimensions. China’s government is wrestling with whether to enforce capacity discipline through its “anti-involution” (反内卷) policy, which would restrict new investment and mandate production cuts. Early 2025 signals suggested movement in this direction, but enforcement remains incomplete. Meanwhile, the US has imposed tariffs on Chinese panels from Southeast Asian manufacturing hubs ranging up to 3,500%, and the EU is conducting its own subsidy investigations.
What This Means for Investors
The strategic question is not whether solar technology will continue to advance — it will. The question is who captures the value from that advancement, and when. Three dynamics are worth tracking closely.
First, the consolidation cycle. Every prior oversupply crisis in solar ended with a wave of bankruptcies and acquisitions that left the survivors holding more market share and lower cost structures. Investors who identified the survivors early captured outsized returns. The current crisis is creating the same opportunity — but identifying the survivors requires understanding which companies have the balance sheet to outlast the downturn and the technology pipeline to compete in the TOPCon-to-tandem transition.
Second, the geography of manufacturing is shifting. US tariffs have accelerated investment in domestic solar manufacturing, with US capacity expected to reach 55–60 GW per year by end of 2025 — and more than half of it built by Chinese firms establishing local operations. The IRA’s manufacturing tax credits have made US-made panels competitive despite higher labor costs. This creates a bifurcated market: Chinese-made panels dominate emerging markets and non-US/EU geographies; locally manufactured panels dominate protected markets at higher prices.
Third, the next technology transition is beginning. Perovskite tandem cells are moving from laboratory records to pilot production lines. JinkoSolar, LONGi, Trina Solar, and Tongwei all have perovskite tandem programs at various stages of maturity. The companies that achieve manufacturing-scale tandem production first will be able to charge premium prices in a market where efficiency gains translate directly into lower installation costs per unit of electricity generated. The race is on — and it will define the industry’s hierarchy for the 2030s.
✦ THE SCOPE · PART 1 KEY TAKEAWAYS
- Solar module prices have fallen over 99% since the 1970s, driven by Swanson’s Law — a consistent 20% cost reduction for every doubling of cumulative shipments.
- TOPCon is now the dominant commercial technology; perovskite tandem cells are in advanced development with world records above 34.8% efficiency.
- The industry is in a severe oversupply crisis — global capacity is roughly 2× demand, margins are deeply negative, and a consolidation cycle appears inevitable.
- Geopolitical trade barriers are reshaping manufacturing geography, creating premium-priced domestic markets in the US and EU alongside ultra-low-cost Chinese export pricing.
- The companies that emerge from the consolidation with strong balance sheets and perovskite tandem pipelines are the ones to watch for the 2027–2032 upcycle.
THE SCOPE · SOLAR SERIES
PART 1 · YOU ARE HERE
50 Years of Tech & The Oversupply Crisis
PART 2 · COMING NEXT
AI Is Eating the Grid: Solar + ESS Through 2030
PART 3 · COMING SOON
Where to Invest: China vs US vs Korea Solar Stocks
This content is produced by The Scope for informational purposes only and does not constitute investment advice. All investment decisions are the sole responsibility of the reader. The Scope accepts no legal liability for actions taken based on this analysis.